FLORIDA LANDFALL
As Wilma approached the Florida peninsula, government agencies shifted their attention to the dangers of a landfalling hurricane. Although hurricane force wind presents a clear danger, to some degree this focus on wind speed distracts attention from the far more deadly aspects of hurricanes, namely storm surge, tornadoes and inland flooding. While storm surge is an isolated danger to coastal areas, tornadoes and inland flooding can wreak havoc hundreds of miles away from the coast.
Wind
The potential for property damage and injury from
hurricane force wind is readily apparent. Even the smallest pieces of debris
become hazardous missiles capable of penetrating the walls of lightly built
structures. Manufactured housing, home to great numbers of the elderly in
Florida, is particularly vulnerable to destruction. Wilma came ashore just south of Everglades City as
a strong Category 3 hurricane just before 7am on October 24, packing sustained winds of approximately 110 knots (127
mph) and a central barometric pressure of 950mb.
The graph below, from the automated weather station at Fowey Rocks, tells the tale of Wilma's approach and landfall. At the time of final reading (8am on the 24th) wind speeds had reached 95 knots, a 65 knot increase in just 12 hours. The plummeting of the barometric pressure, particularly in the hours just after midnight, sent a clear message that destructive force was on the way.
|
Wind speed and barometric pressure history as recorded by the CMAN station at Fowey Rocks, Florida. There's no mistaking the fact that a hurricane was on the way. |

While automated weather stations like Fowey Rocks provide important real time measurements, wind analyses from the Hurricane Research Division (HRD) provide valuable after-the-fact summaries. In addition to a contour-like representation of wind speeds, these images provide the overall structure of wind velocity distribution associated with a tropical cyclone. Each analysis also contains an arrow pointing in the direction of the maximum wind. These HRD Wind Analyses are produced by combining a variety of surface wind observations, which are conveniently listed at the top of each analysis, and then adjusting the output to a standard surface wind height of 10 meters.
|
|
Wind analysis from 6:30am October 24, 2005 (full image). Graphic from the Hurricane Research Division. |
Wind analysis from 2:30pm October 24, 2005 (full image). Graphic from the Hurricane Research Division. |


The wind analysis prepared for the period just before landfall (Figure 1) has been annotated to show the region of maximum wind (100 kts) located 39 nautical miles southeast of Wilma's center. At this time, hurricane force winds extended 101 nautical miles (nm) to the southeast of the storm's center. The analysis prepared at 2:30pm (Figure 2), shows that the strength of Wilma's wind did not suffer on its journey across the Florida peninsula. The maximum observed surface wind rose to 106 knots and was located 64 nautical miles southeast of the storm's center. The field of hurricane force winds in the southeast quadrant expanded from 101nm to 148nm. This observation of Wilma's wind field stands in contrast to the commonly held belief that the strongest winds are always located in a hurricane's right front quadrant.
Moving at an average speed of 25 mph, Wilma finished its northeastward journey across Florida in slightly more than 4 hours, leaving behind a wide swath of uprooted trees, roof damage, broken windows and downed power lines. Nearly three million people were left without electricity.
With Wilma safely over the Atlantic, the Soldani family of Ft. Lauderdale ventured outside to assess the damage to their home and neighborhood. Their preliminary report offered the following observations and photographs:
-
hurricane shutter destroyed during the height of the storm
-
twenty-five foot Jacaranda tree "gone"
-
standing trees stripped of leaves
-
utility poles broken in half
-
wind driven rain under the front door
-
thirty-foot oak tree split in half
-
residential roof failures
-
signs and billboards damaged or destroyed
|
|
Exterior damage from Hurricane Wilma in the Ft. Lauderdale area. Photo courtesy of Winn Soldani. |
Interior damage from Hurricane Wilma in the Ft. Lauderdale area. Photo courtesy of Winn Soldani. |


Storm Surge
In the aftermath of Hurricane Katrina in 2005, the dangers
and destructive consequences of storm surge are now widely recognized. Storm
surge is simply the water that is pushed onto the shore by the ferocious winds of an
advancing hurricane. The densely populated nature of our coastal areas, and the
fact that most of our coastline lies less than ten feet above sea level,
combine to make storm surge a tremendous risk.
|
Storm surge potential output from the SLOSH model (full image). Graphic obtained from the Miami office of the National Weather Service |

Potential storm surge height is a component of the Saffir-Simpson Hurricane Intensity Scale. A Category 1 hurricane has the potential to produce a storm surge of three to five feet while a Category 5 storm is capable of generating a surge eighteen feet or greater. When a hurricane makes landfall at or near high tide, the storm surge is added to the existing tide and greatly amplifies flooding.
Early on the 24th, the Miami Office of the National Weather Service (NWS) issued a storm surge warning for southern Florida and listed the threat level as extreme. An extreme warning contains such language as "widespread inundation of the immediate coastal zone...possibly reaching several miles inland; extreme beach erosion with several new inland cuts likely created; large section of near-shore roads washed out; an extreme threat to life and property within the coastal zone". If the forecast verified, significant destruction would occur along the coast.
A special computer model, SLOSH (Sea, Lake and Overland Surges from Hurricanes), has been developed to estimate the storm surge associated with a hurricane of a specific magnitude. In addition to the characteristics of the hurricane, the SLOSH model incorporates the geographic nature of the area, including water depths, bay and river configurations and other natural and manmade features, to arrive at a very specific assessment of potential storm surge. Although the SLOSH model predicted a storm surge of thirteen to eighteen feet, the maximum storm surge associated with Wilma was seven feet and resulted in extensive flooding near Chokoloskee in Monroe County. Minor surge flooding was also reported in Downtown Miami and Northeast Miami.
|
|
Key West storm surge flooding in the aftermath of Hurricane Wilma. Photographs from the Key West office of the National Weather Service. |
|


Key West experienced a storm surge of approximately five to six feet, which resulted in parts of the city being flooded with two to four feet of water. The ninety percent of Key West's residents that chose not to evacuate were extremely fortunate. A moderate shift in Wilma's path would have subjected the exposed island to the full force of the storm's wrath.
Tornadoes
Studies indicate that more than half of
landfalling hurricanes produce at least one tornado. These hurricane generated
tornadoes are usually spawned from the right-front quadrant of the storm, where
the sustained wind speed is usually the greatest. However, they may also erupt from the spiral rainbands that form away from the cyclone's center. These ribbons
which flow cyclonically (counter clockwise) inward towards the eye help maintain the structure of the
storm and are responsible for most of the precipitation and tornadoes
associated with a hurricane.
While hurricane generated tornadoes are weak cousins compared to the twisters on the Great Plains, they still cost lives and produce considerable destruction. Some meteorologists believe that tornadoes are responsible for the uneven damage seen in a hurricane's aftermath. As a result of this link between landfalling hurricanes and tornadoes, it is common for tornado warnings to be posted for the region experiencing the effects of a landfalling hurricane.
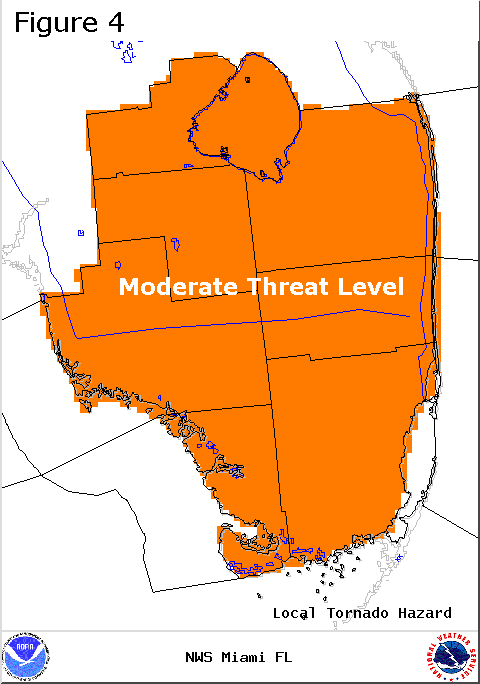
As Wilma approached Florida in the early hours of October 24, 2005, the Miami office of the NWS published the tornado threat graphic (Figure 4) and listed the threat level as moderate. In the context of this graphic, moderate threat means "a 16% to 25% probability of minor tornado damage (damage consistent with that caused by F0 tornadoes." An F0 tornado, as coded by the Fujita Tornado Scale, would result in damage to chimneys, a few downed trees and power lines, and damage to lighter-weight outbuildings.
Although a moderate threat level was posted, only one confirmed tornado resulted from Wilma. This tornado was observed in rural Collier County, near the town of Copeland, at approximately 2:30am on the 24th, a number of hours prior to landfall. Assigned an intensity of F1, it snapped power poles, downed large trees and damaged a number of mobile homes. Fortunately, the tornado caused no fatalities.
|
|
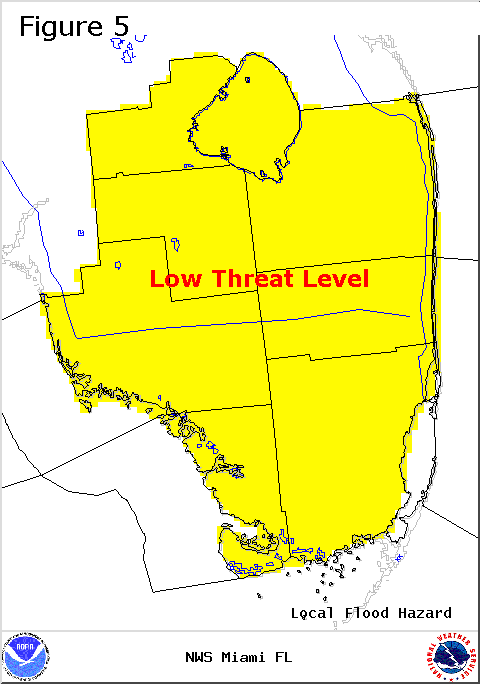
Local warnings issued by the Miami office of the National Weather Service early on the morning of October 24, 2005 as Hurricane Wilma was preparing to make landfall. (Left) Local tornado warning (right) Local flood warning. |
|
Inland Flooding
Over the past 30 years, 59% of tropical cyclone deaths in the United States were
related to freshwater flooding. The fatalities linked to inland flooding are the
reason why 63% of all US tropical cyclone deaths occur in counties that are not
along the coast. It is estimated that 23% of US tropical cyclones deaths are
people who drown in their automobiles attempting to flee rising flood
waters.
|
|
Radar image from 11:45am on October 24, 2005 from the Miami office of the National Weather Service (full image). The hurricane's spiral bands have been identified. |
Radar-derived three day precipitation estimate from the National Weather Service (full image). The areas in red represent storm totals of seven to nine inches. |


The rain and thunderstorms in the rainbands associated with a
hurricane make landfall much earlier than its eye. The National Weather Service forecast issued at
5:20am on the 23rd for Florida's southwest coast (excerpt below) confirmed that
the showers and thunderstorms associated with Wilma's spiral bands were expected
in the region nearly forty-eight hours ahead of landfall.
TODAY...CLOUDY WITH NUMEROUS SHOWERS AND ISOLATED THUNDERSTORMS. HIGHS IN THE MID 80S. SOUTHEAST WINDS 5 TO 10 MPH. CHANCE OF RAIN 70 PERCENT. |
Wilma's reasonably brisk forward pace kept the
danger of flooding to a minimum. Although the National Weather Service issued a
flood warning (Figure 5) early on the 24th, the risk was listed as low. The
radar image (Figure 6) from 11:45am on October 24 shows Wilma's rainbands as it
crossed the state. As
shown on the chart of radar-derived precipitation estimates for the period
October 22 to October 25 (Figure 7), although there were isolated areas that
witnessed storm totals of seven to nine inches (shaded in red) most of
the area in Wilma's path experienced less than five inches (shaded in yellow and
green) of rain over the three day period.