ENVIRONMENTAL NECESSITIES
In stark contrast to their ferocity, hurricanes are remarkably fragile systems. Just the right combination of atmospheric and oceanic ingredients are needed to promote the development of a hurricane. Even after a hurricane forms, a little too much dry air, a decrease in water temperature or an increase in wind shear, and even the most powerful storms begin to show signs of decay. It is ironic that one of Mother Nature's most destructive forces demands careful nurturing in order to maintain its existence. The journey from a depression to a hurricane is a perilous one and the majority of tropical systems don't make it.
The development of a hurricane is predicated upon the existence of several favorable environmental conditions, including sea surface temperature, vertical wind shear, the Coriolis force and a moist environment. Each of the required conditions will be discussed in the context of Hurricane Wilma's development.
Sea
Surface Temperature
A
reasonably deep layer of warm water (150 feet) with a temperature of at least
26.5° C (80° F) is required for hurricane development. The depth of the warm layer is very important,
particularly with slow moving hurricanes. As a hurricanes passes over water, its
extraordinary winds are capable of mixing the ocean to considerable depths. If the layer of warm
water is relatively thin, cold water is quickly brought to the surface through a
process called upwelling and the hurricane's development is hindered.
Warm, moist water is the fuel that sustains a hurricane, and therefore it must be present in ample amounts. The influx of warm, moist air into a hurricane adds energy to the system as water vapor condenses to form liquid droplets. As this condensation takes place, latent heat is released into the surrounding atmosphere. This process increases the overall temperature profile of the air column, ultimately contributing to the lower barometric pressure at the surface. This warming of an air column by latent heat is an integral facet of hurricane development.
The chart below of mean sea surface temperature for the period October 10 to 15, 2005 (Figure 1) shows that conditions were very favorable for the development of the tropical depression that would become Wilma. Temperatures were 28°C or greater in a wide swath of Atlantic Ocean extending from the coast of Africa into the Gulf of Mexico.
|
Mean sea surface temperature for the period October 10 to 15, 2005. Note the vast expanse of water suitable for hurricane formation (=> 28°C). Image provided by the NOAA-CIRES Climate Diagnostics Center, Boulder, Colorado. |

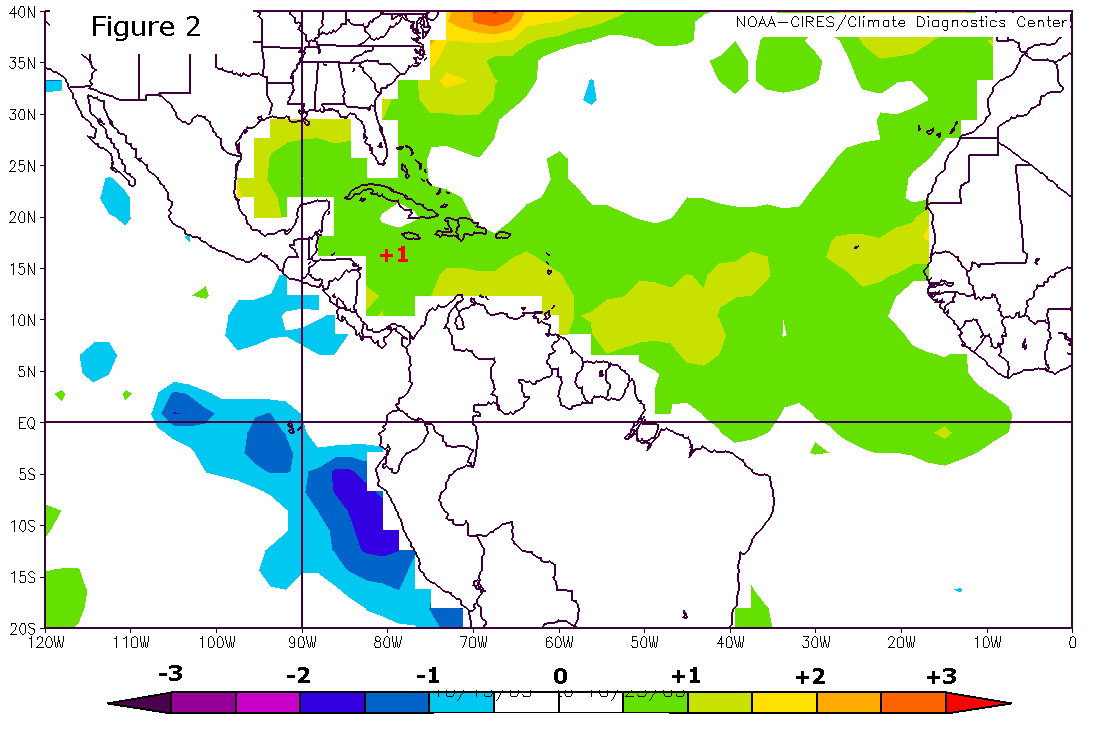
In fact, the chart of surface temperature anomalies for October 10 to 15, 2005 (Figure 2), indicates that the temperature was 1°C warmer than the long-term mean for the period. Granted, this is not a significant difference, but it clearly demonstrates that Wilma had a greater than average source of fuel.
|
Mean sea surface temperature anomalies for the period October 10 to 15, 2005. The water in the region of Wilma's development is 1°C warmer than the long-term mean. Image provided by the NOAA-CIRES Climate Diagnostics Center, Boulder, Colorado. |
Vertical Wind Shear
Developing tropical systems, and even mature hurricanes, are particularly
susceptible to vertical wind shear. Wind shear is the difference in wind
direction and speed as you ascend in the atmosphere. By convention,
meteorologists calculate wind shear by comparing the values for speed and
direction at two levels --850mb and 200mb. These pressure values are roughly
found at 1,500 meters (4,921 feet) and 12,000 meters (39,369 feet) above the earth's
surface and are two of the mandatory pressure levels where atmospheric
conditions are regularly measured.
Low values of vertical wind shear are necessary for hurricane development, but the value need not be zero. In fact, hurricanes are able to persevere as long as vertical wind shear is less than 10 meters per second (22.3 mph). Vertical wind shear of a magnitude greater than 10 meters per second suppresses hurricane development by disrupting the storm's convective forces and altering its overall structure.
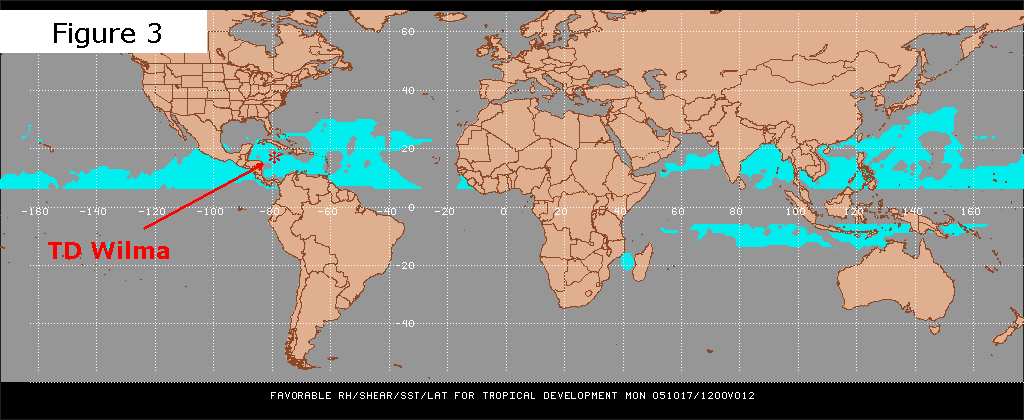
The chart below (Figure 3), produced at 8am on October 17, 2005, displays those regions (in light blue) where vertical wind shear was light, and therefore supportive of Tropical Storm Wilma's development into a hurricane.
|
Regions of favorable vertical wind shear (shown in light blue) as of 8AM on October 17, 2005. From the Penn State Tropical E-Wall. |
Meteorologists also have resources that allow them to analyze past trends in vertical wind shear and to predict future conditions. There are a number of sophisticated computer models that use existing atmospheric conditions as input to render a prediction of future weather conditions. In many instances, the data from these programs are used to create graphics, commonly called progs, that visually display the state of the atmosphere at a future time. A variety of the organizations make these resources available on the Internet. For example, the prog below (Figure 4) was produced from the Canadian Meterological Centre (CMC) model and was obtained from the Penn State Tropical Ewall.
|
||
Lower left panel from the CMC prog initialized on October 15, 2005 at 00Z and valid at 00Z on October 16, 2005 (full image) The chart shows that Tropical Depression Wilma was forming in an area of light wind shear. Prog obtained from the Penn State Tropical E-wall. |
||

his particular panel, one of four available, was produced at 8pm on October 15, 2005 and was "valid" twenty-four hours later at 8pm on the 16th. It provides a prediction of the nature of vertical wind shear by using shading and an indication of its direction by the use of streamlines.
The white shading in the region of Tropical Depression Wilma represents minimal vertical wind shear -- a conducive environment for Wilma's further development. This region is in stark contrast to the substantial westerly shear, on the order of 22 meters per second (49.3 mph), that was predicted along the southern Gulf Coast and well into the Gulf of Mexico. A tropical depression wouldn't stand a chance of reaching hurricane status in such an environment.
A note of caution--no single prog should be taken as gospel. The atmosphere is remarkably complex, and no single computer model derives a correct forecast each time it is initialized. It is not uncommon for the same computer model to forecast dramatically conditions just a few hours later. Meteorologists regularly review output from an assortment of models in an effort to arrive at a consensus forecast that is consistent with their human assessment of current conditions.
Coriolis Force
Although warm water is found near the Equator, it is very rare for tropical
cyclones to develop between five degrees
south and five degrees north latitude, or within approximately 300 nautical miles
(nm) of the Equator. The
reason is the virtual absence of the Coriolis force at such low latitudes. Only two tropical cyclones have formed within this region since
observations began; Typhoon Sarah in 1956 that formed near 3.3 degrees north
latitude and
Typhoon Vamei which formed at approximately 1.5 degrees north latitude in December 2001.
|
||
Coriolis force in the Northern Hemisphere. From COMET. |
||
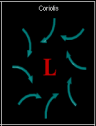
The Coriolis force is an apparent force that causes the deflection of moving objects to the right in the Northern Hemisphere and to the left in the Southern Hemisphere. The graphic to the right demonstrates the relationship between moving air parcels and an area of low pressure in the Northern Hemisphere. The Coriolis force is essentially zero at the Equator and increases as you travel north and south toward the poles. The deflection resulting from the Coriolis force also increases as the strength of the wind increases. As it relates to tropical systems, the Coriolis force is responsible for promoting cyclonic (counter-clockwise) rotation.
The depression that served as the precursor to Wilma formed at approximately 17.6 degrees north latitude and 78.8 degrees west longitude. At this latitude, the depression was sufficiently far (more than 1000 nautical miles) from the Equator to allow the Coriolis force to play its role.
Moist Environment
In
addition to moist air at the surface, a healthy tropical system requires a
steady supply of water vapor higher in the atmosphere. The infusion of dry
air into a tropical system results in the air parcels in the column becoming
cooler than their environment, which leads to negative buoyancy and the tendency
of the parcels to sink. Sinking air parcels, referred to as subsidence, tend to suppress convection
and cloud formation, and the storm begins to suffer.
Meteorologists have methods to determine the moisture content in a region where a tropical system is forming. Relative humidity is regularly calculated at two pressure levels in the atmosphere, 700mb and 500mb -- approximately 10,000 feet and 18,000 feet above the earth's surface.
|
Lower right panel from the CMC prog initialized on October 15, 2005 at 00Z and valid at 00Z on October 16, 2005 (full image) The chart shows that Tropical Depression Wilma was forming in an area of high relative humidity. Prog obtained from the Penn State Tropical E-wall. |

he above prog (Figure 5), produced at 8pm on October 15, 2005 and "valid" twenty-four hours later at 8pm on the 16th, provides a prediction of the nature of relative humidity. In addition, the hatch marks identify those areas where sea surface temperatures are greater that 26°C and therefore favorable for tropical cyclone development. As the prog indicates, Tropical Depression Wilma was forming in an area, shaded in light green, where relative humidity was greater than 70%. However, a large region of dry air, represented by the brown shading over most of the Gulf of Mexico and the eastern United States, posed a possible impediment to the depression's development.
Late on October 16, the NHC Discussion 5 noted that "water vapor imagery indicates dry mid-level air has been pushing southward toward the center...this inhibiting factor is expected to be temporary however." Acknowledging the adverse nature of dry air, the NHC had employed satellite imagery to monitor the environment.
The satellite water vapor image (Figure 6) from 6:15pm on October 17, 2005 has been annotated to highlight the region of dry air to the north and northwest of Tropical Depression Wilma. Although Figure 5 and Figure 6 reference different days, the regions characterized by dry air are reasonably consistent.
|
||
Satellite water vapor image from 6:15pm on October 17, 2005. Note the dry air to the north and northwest of Tropical Depression Wilma. Image from the National Hurricane Center. |
||

Tropical disturbances don't simply spring to life and mature into hurricanes once all of the required environmental conditions are present. The next section will examine the broader mechanisms that are necessary for the formation and development of a tropical cyclone.