Convective Potential
Surface Temperature/Dew Point
Moisture is an essential ingredient for the development of severe weather, and forecasters use a variety of resources to determine the amount of moisture available in the atmosphere. The series of charts (below) show the combined plot of surface temperature, surface dew point and barometric pressure from 15Z to 17Z on March 30th. At 15Z (9 AM CST), the temperature in southern Oklahoma was already in the mid 60s and an area of dew points in the mid to upper 50s extended across much of the state. Although the region of dew point in the 50s declined slightly between 15Z and 17Z, temperatures near the Texas-Oklahoma border rose to nearly 75° F. The airmass in south central Oklahoma was unusually warm for the end of March.
|
|
|||
|
Surface Temperature, Dew Point and Pressure on 3/30/2006 from the SPC. |
|||
Moisture Convergence
Another method used to determine the availability of moisture is a chart of surface moisture convergence such as the series (below) from 15Z to 17Z. The values on the chart represent the result of a formula that combines the effect of moist air advection and converging winds. High values of moisture convergence indicate that fuel, in the form of moist air, and converging winds is elevated in an area, thereby raising the potential for thunderstorm development. Throughout the time period of the charts, central Oklahoma was encompassed by an area of increased surface moisture convergence.
|
|
|||
|
Moisture Convergence 3/30/2006 from the SPC. |
|||
Theta-E
Theta-E is meteorological shorthand for Equivalent Potential Temperature. Increases in dew point and temperature result in an increase in the value of Theta-E, therefore high values of Theta-E represent warm moist air. Since warm moist air is often associated with atmospheric instability, forecasters view regions of high Theta-E as ripe for the development of severe weather.
|
|
|||
|
Theta-E and Theta-E Advection on 3/30/2006 from the SPC. |
|||
The series of charts of Surface Theta-E and Theta-E advection (above) indicates that at 15Z, Theta-E values across south central Oklahoma ranged from 328 K to 332 K, and that the focus of Theta-E advection was located in the southwestern corner of the state. A review of the charts for 16Z and 17Z shows that while the value of Theta-E remained fairly constant, the focus of Theta-E advection expanded eastward. The charts confirm that not only did the atmosphere in south central Oklahoma contain an ample supply of warm, moist air, but also that this fuel source was on the increase in the hours prior to the issuance of the tornado watch.
Lifted Index
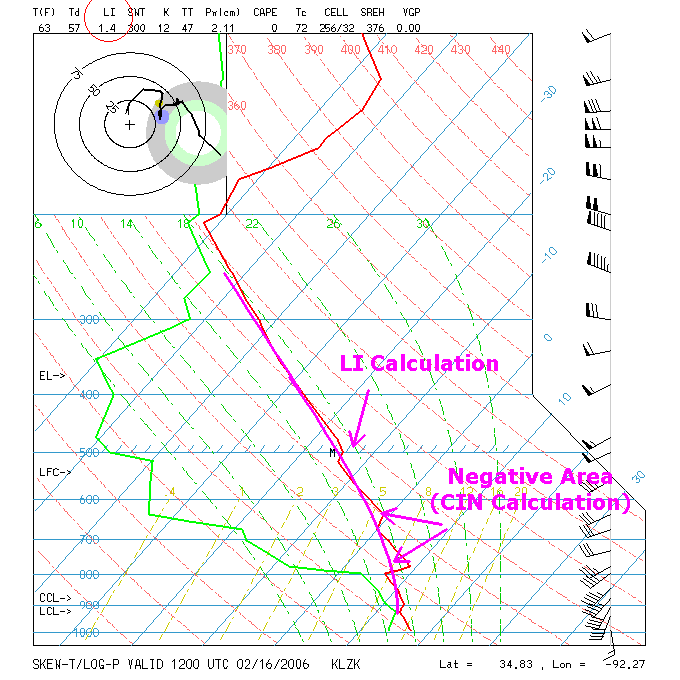
The Surface Based Lifted Index (SBLI) is a relatively simple parameter that reflects the difference in temperature at 500mb between the environment and an air parcel that has been lifted moist adiabatically (by following the moist adiabat on a Skew-T) from the Lifting Condensation Level (LCL). A negative LI indicates that the lifted parcel is warmer than its environment and positively buoyant. LI values below -5 suggest the possibility for strong convection, while values greater than 0 generally indicate that the risk of severe weather is small.
When severe weather threatens, forecasters at the SPC examine the distribution of SBLI values across a region. The series of charts from 15Z to 19Z (below) display SBLI values along with Surface-Based Convective Inhibition (SBCIN). SBCIN is a measure of the amount of energy (in joules per kilogram or j/kg) required to raise an air parcel from the surface to the Level of Free Convection (LFC). Convective Inhibition (CIN) refers to that layer of a sounding where a lifted parcel is colder than its environment and negatively buoyant. On a Skew-T diagram, SBCIN is the region below the LFC that is to the left of the temperature sounding and to the right of the dry adiabat associated with a surface parcel. This region of negative buoyancy must be overcome by one of the following methods before storms can develop:
- heating of the air near the surface
- moistening of the air near the surface
- synoptic-scale lifting such as a cold-front or upper-level dynamics
|
|
|||
|
SB Lifted Index and CIN on 3/30/2006 from the SPC. |
|||
At 15Z, the SBLI over most of south central Oklahoma was -5 with a small bullseye of -6, indicating a moderately unstable atmosphere. CIN in this same region was relatively low, with values at or below 25 j/kg. Although the SBLI increased to -6 over much of region between 15Z and 16Z, at 17Z the SBLI over south central Oklahoma was -5. While CIN values remained supportive of convection over southern Oklahoma, values were considerably higher (100 j/kg) over most of northern Texas, indicating an atmosphere that was less conducive to convective development. This may help to explain why the tornado watch did not include northern Texas.
Convective Available Potential Energy
Although a useful tool, the Surface Based Lifted Index measures instability at only a single level (500mb) and therefore may not be representative of the convective potential of the atmosphere. Convective Available Potential Energy (CAPE) is the sum of the positive buoyant energy (in joules per kilogram) a rising surface parcel would possess as it travels from the Level of Free Convection to the Equilibrium Level. In contrast to the Lifted Index, CAPE provides an assessment of the convective potential through a deep layer of the atmosphere.
|
|
|||
|
MLCAPE and CIN on 3/30/2006 from the SPC. |
|||
The chart series above presents the 100mb Mean Layer CAPE (MLCAPE) and Mean Layer CIN (MLCIN) from 15Z to 17Z on the 30th. MLCAPE differs from surface-based CAPE in that the lifted parcel begins from an average of the dew point and temperature in the lowest 100mb. The values of MLCAPE are more realistic than surface-based CAPE when the air near the surface is very moist. During the duration of the chart series, a narrow region of MLCAPE of 1000 j/kg stretched from northern Texas through Oklahoma and into Kansas. Consistent with the SBLI values discussed earlier, MLCAPE values in this range suggest a moderately unstable atmosphere.
Imagery
In addition to assessing the convective potential of a region, SPC forecasters have satellite and radar imagery to identify where storms are forming, and to assess their structure and direction of movement. The approach of the dryline from the western border of Oklahoma is clearly evident in the series of visible satellite images below. Also, note the alignment of the line of convection and the appearance of watch box #110 in the image at 1732Z.
|
|
|||
|
Visible Satellite Imagery on 3/30/2006 from the SPC. |
|||
The series of base reflectivity radar images clearly shows the line of thunderstorms that developed along Oklahoma's western border with Texas and moved southeasterly toward southern Oklahoma.
|
|
|||
|
Radar Imagery on 3/30/2006 from the SPC. |
|||
SPC forecasters had ample evidence that conditions in southern Oklahoma were conducive for an outbreak of severe weather. Satellite and radar imagery provided confirmation that thunderstorms had formed and were approaching this same area. Was a severe thunderstorm or tornado watch warranted? Let's examine some of the parameters used to answer this question.
Next: Analyzing The Potential For Supercell Thunderstorms
Previous: Synoptic Support
© 2005-2006 Mark A. Thornton