Forecasting Supercell Thunderstorms
Vertical Wind Shear
The change in either the speed or direction of the wind with increasing height is referred to as vertical wind shear. The graphic below provides a very simple one-dimensional example of wind shear (the direction at all levels is west). The wind one kilometer above the surface is blowing at a speed of five knots, while at a level of four kilometers the wind speed is twenty knots. In this example, the value of wind shear between one kilometer and four kilometers would be fifteen knots.
 |
|
A graphic example of vertical wind shear. |
Surface to 6 Kilometer Shear Vector (kts)
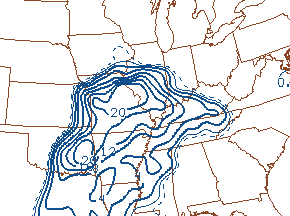
In contrast to air mass thunderstorms, supercell thunderstorms require sufficient vertical wind shear to create a tilt in the storm that separates its updraft from its downdraft. Without such a separation, the storm's cool downdraft would quickly spread out and extinguish the updraft -- the storm's source of energy. One parameter used to forecast the likelihood of supercell development is the surface to 6 kilometer (km) shear vector. This parameter is calculated by determining the change in wind speed and direction from the surface to a height of six kilometers, which is just slightly above the standard height of 500mb.
|
|
|||
| Surface to 6 km Vertical Wind Shear - March 12, 2006 from the SPC. | 0Z (6PM CST) | 1Z (7PM CST) | 2Z (8PM CST) |
| Full Image | Full Image | Full Image | |

Experience has shown that values of surface to 6 km vertical wind shear in the range of thirty-five to forty knots correlate to well-organized and long-lasting supercell thunderstorms. The series of images (above) show that in the hours preceding the tornado outbreak in central Illinois, the surface to 6 km vertical wind shear values were steady at approximately seventy knots. Such values are consistent with the long-lasting supercell that formed in the Great Plains and traveled nearly seven hundred miles before dissipating in southern Michigan.
Storm Relative Winds
Supercell thunderstorms come in three varieties: low-precipitation (LP), high-precipitation (HP) and classic supercells (CL). As the name suggests, LP supercells are characterized by very little precipitation and, although they may possess funnel clouds, LP storms rarely produce tornadoes. Compared to LP and CL, HP storms produce considerably more precipitation in both the forward flank and around the updraft of the storm. Although HP storms are capable of producing large hail and damaging winds, their robust downdrafts tend to inhibit the development of tornadoes. In between LP and HP storms falls the classic supercell, the source of most tornadoes. The precipitation associated with a CL supercell primarily falls in the forward region of the storm.
In reality, supercells don't always adhere to the neat categorization provided above, and each can be destructive in its own way. This difference provides an incentive for forecasters to predict the type of supercell a region may experience. One resource for developing such a prediction is the 9 to 11 Kilometer (km) Storm Relative Winds. High precipitation supercells typically form when upper-level storm relative winds are less than forty knots. At the upper end of the spectrum, LP supercells usually exist in environments where storm relative winds are greater than sixty knots. The middle-of-the-road storms, known as CL supercells, thrive when storm relative winds are greater than forty but less than sixty knots.
The 9 to 11 km storm relative winds play a role in supercell types by influencing the distribution of hydrometers as they emerge from the updraft in the upper levels of the storm. The precipitation from HP storms falls in the general area of the updraft because storm relative winds are too light to distribute it downstream. In contrast, the precipitation resulting from LP storms is transported downshear by brisk storm relative winds.
|
|
|||
| 9 to 11 km Storm Relative Winds - March 12, 2006 from the SPC. | 0Z (6PM CST) | 1Z (7PM CST) | 2Z (8PM CST) |
| Full Image | Full Image | Full Image | |

The charts of 9 to 11 km storm relative winds (above) from 6 to 8 PM indicate that storm relative winds over central Illinois at 6 PM were near seventy knots, suggesting that the approaching supercells would likely be of the LP variety. A mere two hours later at 8 PM, storm relative winds had declined to fifty knots, creating an environment compatible with CL supercells. It should be noted that the supercell storm produced approximately two inches of rain in the twelve hour period that ended at 7 AM CST Monday.
Supercell Composite Parameter
The Supercell Composite Parameter (SCP) is a composite forecasting index calculated by combining Storm Relative Helicity (SRH), Most Unstable Convective Available Potential Energy (MUCAPE) and Effective Bulk Shear. SRH is a measure of the low-level wind shear relative to the movement of a thunderstorm and is used to measure the nature of the storm's rotation. MUCAPE is a calculation of CAPE resulting from the most unstable air parcel in the lowest 300mb of the atmosphere. MUCAPE, as a measure of buoyancy, provides an assessment of the potential for the development of convection. Effective bulk shear, similar to the surface to 6 km vertical shear vector, is the value of the wind shear from the level of the most unstable air parcel up to a height equal to 40-60% of the equilibrium level -- the pressure level at which the lifted parcel becomes colder than its environment, and therefore negatively buoyant.
|
|
|||
| Supercell Composite Index - March 12, 2006 from the SPC. | 0Z (6PM CST) | 1Z (7PM CST) | 2Z (8PM CST) |
| Full Image | Full Image | Full Image | |
Since each of the components has a different scale, it is necessary to normalize the values prior to calculating the SCP. The values of SCP can be used as a guideline to discern the potential for the development of supercell or non-supercell thunderstorms, and whether surface-based or elevated supercells will form.
The charts of SCP (above) show that values of SCP in central Illinois ranged from sixteen to twenty from 6 to 8 PM CST. Based upon materials from the Storm Prediction Center, values of SCP in this range suggested the development of surface-based supercell thunderstorms.
Storm Relative Helicity
Storm Relative Helicity combines the vertical wind structure, motion of the storm and the rate that the storm is ingesting streamwise vorticity into a single forecasting parameter represented in meters per second. As a forecasting parameter it is used to predict the likelihood that an updraft in a right-moving supercell will develop cyclonic rotation.
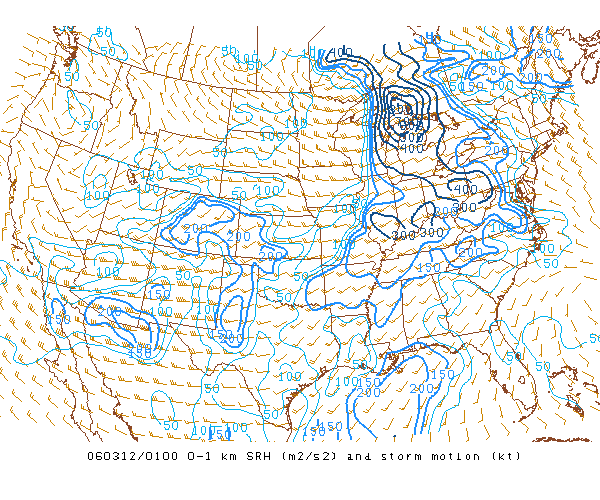
Regions characterized by values of surface to 1 km storm relative helicity exceeding one-hundred m^2/s^2 have a greater chance of tornado development. The series of charts of surface to 1 km storm relative helicity (below) show the dramatic increase in this parameter from 6 PM to 8 PM. At 6 PM, central Illinois had values in the range of one- to two-hundred m^2/s^2. Although technically indicative of an increased potential for tornadoes, this value was at the low end of the spectrum. At 8 PM, the surface to 1 km storm relative helicity had skyrocketed to the four- to five-hundred m^2/s^2 range. Of course, by this time a tornado was churning through Sangamon County on a northeasterly path towards Springfield.
|
|
|||
| Surface to 1 km Storm Relative Helicity - March 12, 2006 from the SPC. | 0Z (6PM CST) | 1Z (7PM CST) | 2Z (8PM CST) |
| Full Image | Full Image | Full Image | |

A review of the forecasting parameters provided above clearly shows that the atmosphere over central Illinois was supportive of classic supercells and tornadoes. Once forecasters are reasonably certain that the atmosphere is conducive for this type development, their focus shifts to predicting and monitoring the storm's general movement.
Next: Monitoring Storm Motion
Previous: Convective Environment
© 2005-2006 Mark A. Thornton