Marine Model Output Statistics (MOS) -- A Unique Wind Forecasting Resource
Published July 2014

Introduction
Sailors spend a lot of time analyzing wind forecasts, whether they're planning a short afternoon sail, preparing for a regatta, or developing a strategy for a long-distance race. Most of this analysis relies on graphical forecast products, such as the wind speed and direction forecast for Lake Huron published by the National Weather Service shown below.

Sailors also have access to a wide variety of similar products on government, university, and private websites (click here for the LakeErieWX resource page). Such imagery contains a wealth of information, is relatively easy to interpret, and can be easily shared with others. In addition to traditional web-based products, smartphone and iPad applications specifically designed for sailors have brought weather forecasting into the cockpit.
Weather Forecast Models
Wind forecast graphics are produced by special computer programs -- dynamic forecast models -- that strive to predict future weather patterns using extremely complex mathematical formulas.
Some of the fastest computers in the world are devoted to weather modeling, but limitations in computer power and the complexity of atmospheric processes result in forecasts that are less than perfect.
While computer-generated forecasts are reasonably accurate during the first two or three days, their accuracy steadily declines over time. The 10-day forecast -- a staple of the evening news -- should be treated with considerable suspicion. In addition, forecast models tend to do a much better job with the large-scale, upper-air features and struggle with weather parameters such as temperature and wind speed near the surface. Therefore, relying solely on traditional forecast graphics for your wind forecasts might not be the best strategy.
Model Output Statistics
In an effort to address the surface forecast limitations of weather models, meteorologists developed Model Output Statistics (MOS) in the 1970s. MOS is a statistical model that is run after the traditional forecast models have completed processing. MOS uses the output from the traditional models in combination with a database of historical observations and a suite of sophisticated equations to produce a special type of forecast for a specific location. Essentially, MOS uses the traditional model output as a starting point and improves the surface forecasts by factoring in long-term weather observations. Although most sailors have never heard of it, MOS is an extremely powerful wind forecasting resource.
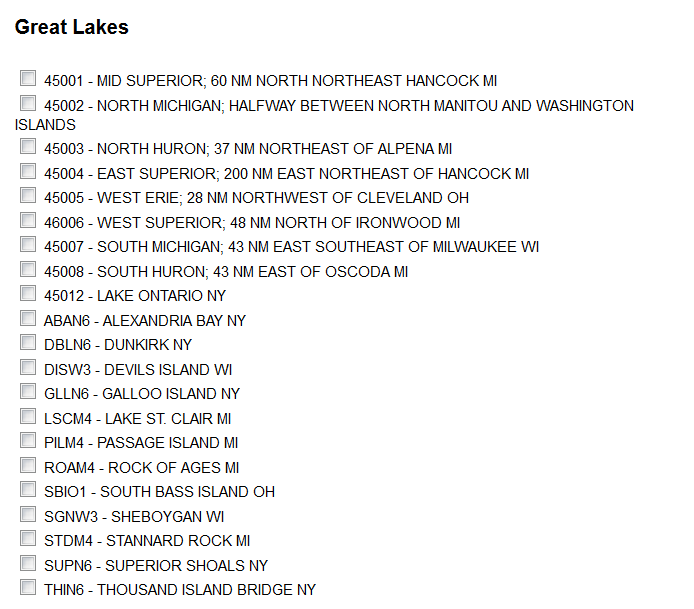
Over the long run, the accuracy of MOS surface wind forecasts will exceed those from traditional computer model forecasts because of its multi-faceted process. Although most MOS locations are airports, forecasts are also created for many of the marine observation stations near the Great Lakes (see below).
Decoding MOS
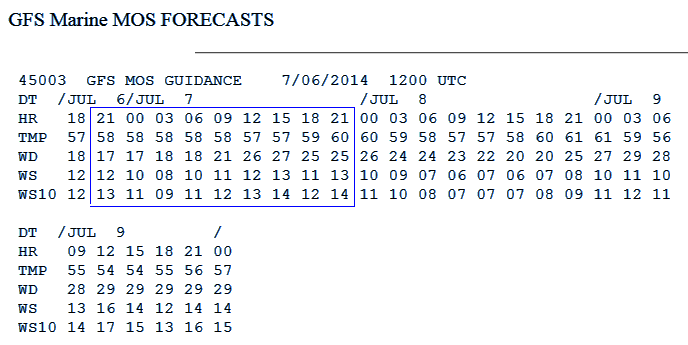
Instead of a colorful graphic, MOS forecasts are presented in a coded, tabular format and cover a three-day period. The MOS forecast issued on July 6, 2014 for Buoy 45003 in northern Lake Huron appears below. Spending a little time learning how to decode a MOS forecast will allow you to add this powerful wind forecasting resource to your toolkit. (It may be helpful to refer to a printed copy of the MOS forecast (click here) while you read the next section.)

Title: The title indicates that the forecast was created by applying MOS to the Global Forecast System (GFS) computer model. MOS forecasts are also produced from the North American Model (NAM).
Location: Indicates the forecast location. This example is for NDBC Buoy 45003 in northern Lake Huron.
DT: The forecast date. This forecast covers a portion of July 6, all of July 7, 8th, and 9th. Click here for an annotated version showing the forecast data for each day.
HR: The hour that the forecast is valid. MOS forecasts are published using Universal Time Coordinate (UTC), also known as Greenwich Mean Time (GMT). To convert from UTC to local time during the summer, subtract four hours in the Eastern Time Zone and five hours in the Central Time Zone. For example, 18 UTC is 2:00 pm Eastern (18:00 UTC - 4:00 = 14:00 local) and 1 pm Central (18:00 UTC - 5:00 = 13:00 local). The first forecast for a day begins at "00" and ends at "21".
TMP: The temperature forecast. For example, the forecast temperature for 21 UTC on July 7 is 60F.
WD: The wind direction is presented as two-digits, and a "0" must be added to the end to get the direction. The wind direction forecast at 21 UTC on July 7 is shown as 25, or 250 degrees when decoded.
WS: The sustained wind speed in knots. The sustained wind speed forecast at 21 UTC on July 7 is 13 knots.
WS10: The sustained wind speed at a height of 10 meters in knots. The 10 meter sustained wind speed forecast at 21 UTC on July 7 is 14 knots.
Using MOS
While not as attractive as a series of forecast graphics, it is much easier and quicker to recognize a significant wind shift using a MOS forecast. I've highlighted the 24-hour period from July 6 at 21 UTC to July 7 at 21 UTC (below) as an example. During this period, the wind direction veers approximately 100 degrees from July 6 at 21 UTC (170 degrees) to 15 UTC on July 7 (270 degrees). It's just as quick to determine that the sustained winds are forecast to remain relatively consistent as the wind veers. Arriving at this same conclusion using forecast graphics would have required you to review at least seven different images.
While MOS adds value to traditional forecast model output, it has one major shortcoming -- it only provides a forecast for specific locations. When using MOS, it is important that you select a site that is reasonably close and meteorologically consistent with the area where you intend to sail. For example, if I were participating in a regatta near downtown Cleveland, Ohio, I would select Burke Lakefront Airport (KBKL) instead of NDBC buoy 45005 located in Lake Erie's western basin. In addition to being much closer to Cleveland, KBKL experiences the daily lake/land breeze cycle that is very common along Lake Erie's southern shore. And, just in case you are wondering, MOS does a good job predicting lake and land breezes.
Sailors competing in the upcoming Mac races might benefit by checking the MOS forecasts for the offshore buoys and several of the stations along the shore in addition to traditional forecast graphics.
MOS is a very powerful and easy to use wind forecasting resource, why not give it a try?
Where To Find MOS Forecasts
- MOS forecasts for Great Lake locations are available on the LakeErieWX Marine Weather Dashboards for each Lake:
- Marine GFS MOS (Scroll down the list to reach the Great Lakes.)
- Marine NAM MOS (Scroll down the list to reach the Great Lakes.)
- One-Stop MOS (List of all stations by state.)