Lake Erie DisplacementDecember 23-24, 2007
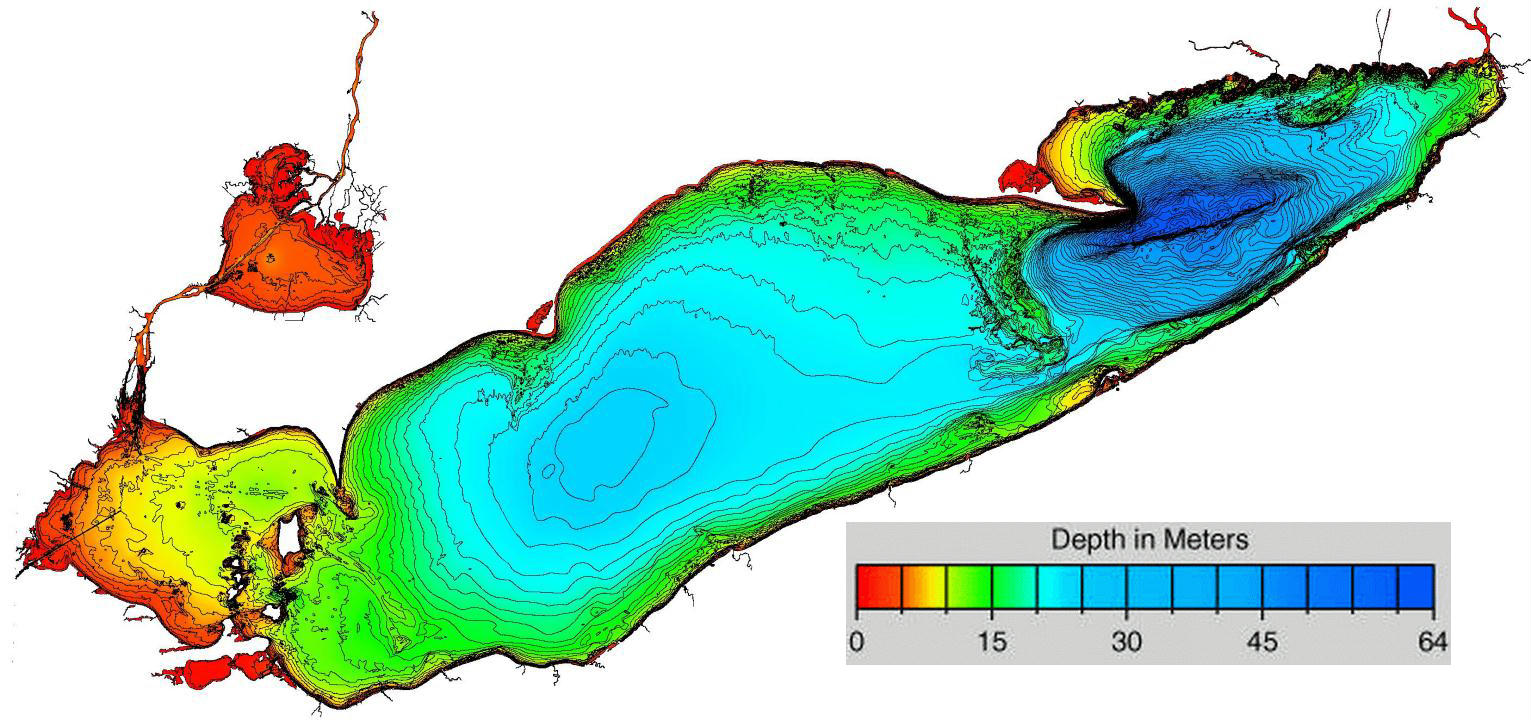
Introduction The Great Lakes are characterized by great contrasts. The largest, Lake Superior, contains approximately 3,000 cubic miles of water, has an average depth of 500 feet (1,332 feet at its deepest) and nearly 2,800 miles of shoreline. At the other end of the spectrum is Lake Erie, with a mere 199 cubic miles of water, an average depth of 62 feet (210 feet at its deepest) and 871 miles of shoreline.
As shown on the bathymetry chart (above), the variations in the depth of Lake Erie are tremendous, with the northeastern basin significantly deeper than the western end of the lake. Although a wonderful recreational resource, Lake Erie' role in commercial shipping is a vital component in the region's economic health. The areas near the mouth of the Detroit River and the port of Toledo, Ohio are among the lake's shallowest spots and are highly susceptible to short-term fluctuations in water levels.
These short-term fluctuation in water level are the result of the southwest to northeast orientation of the lake combined with the western basin's shallow nature and the prevailing weather conditions. The profile of Lake Erie published by The Great Lakes Information Network (GLIN) indicates the record difference in the water level from the west end of the lake to the east end was an astounding 16 feet! Even at levels far below this record, fluctuations in water levels of just a few feet present hazards to both commercial and recreational mariners.
Displacements and Seiches The most significant and long-lasting water level fluctuations, referred to as displacements on Great Lakes forecast graphics, occur in response to strong, prolonged winds blowing across the surface of the lake. Particularly noteworthy displacements when the wind is aligned along the long axis of the lake, southwesterly to northeasterly in the case of Lake Erie.
The process of displacement begins on a very small scale as capillary waves (wavelengths less than 1.7 centimeters) form in response to the transfer of wind energy to the water's surface. Although capillary waves undoubtedly form, scientists are uncertain regarding the precise dynamics of how these small ripples get started on a smooth surface.
If the wind persists and increases in speed, form and frictional drag take over to promote the development of larger waves. In contrast to capillary waves which are restrained by the surface tension of the water itself, the restoring force of waves with larger wavelengths is gravity.
As shown in the graphic to the left, the height and steepness of the waves both promote, and increase in response to, the development of localized areas of low and high pressure in the wave's trough. The area of high pressure on the windward side helps to lift the leading edge of the wave's crest, while the area of low pressure on the leeward helps to deepen the trough. In sort of a positive feedback loop, these pressure patterns help sustain and develop wave heights.
Of course, the overall height of waves is restricted by the combined interaction of wind speed, duration of the wind, depth of the water in which the waves are forming and distance over which the wind and water interact, known as fetch. A nomogram for determining the approximate wave height from these variables may be found here. If these wave development variables favorably interact for a sufficient period, a considerable volume of water can be moved from one end of the lake to the other. In the case of Lake Erie, the shallowness of the western basin is exacerbated while flooding occurs at Buffalo, New York located at the lake's northeastern tip. A demonstration of this process can be viewed on this graphic from the University of Wisconsin Sea Grant Institute.
The National Weather Service (NWS) defines a seiche (pronounced "saysh") as a "standing wave oscillation of water in large lakes usually created by strong winds and/or a large barometric pressure gradient." In the Great Lakes, the term seiche is used generically to describe an increase in water level along a shore, what is referred to here as a displacement. While this paper will adhere to the strict definitions, seiches and displacements are closely related. As the force of wind relaxes, its ability to maintain the unnatural distribution of water in the lake falters and gravity steps in to restore order. The level of the lake does not immediately reach equilibrium, instead is sloshes back and forth - a seiche -- while gravity progressively diminishes the oscillations. Depending upon the magnitude of the displacement, the seiche, although steadily weakening, may persist for a day or two.
A Perfect Setup The weather forecast issued early on December 23, 2007 suggested that conditions would be perfect for the development of a significant displacement of water later in the day and into Christmas Eve. The HPC Daily Weather Map for December 23, 2007 (below) showed a low pressure system centered over Lake Superior with its attendant cold front reaching into the Gulf of Mexico.
The forecast predicted that this system would become more powerful while it lingered over the upper Great Lakes for the next couple of days. The cold front was expected to pass over Lake Erie early on December 23, veering the winds from a southeasterly to southwesterly direction. The NWS forecast for the open waters of Lake Erie issued at 4:19am EST included a warning regarding storm force winds and the following prediction for the wind and wave conditions:
In addition to the marine forecast, the NWS issued a Low Water Advisory at 5:00am EST on the 23rd cautioning mariners of the likelihood that water levels in the western basin would continue to drop, creating an hazard to safe navigation.
The series of forecast guidance images above were produced by the Lake Erie Operational Forecast System (LEOFS) and predict the displacement of water from one area of the lake to another from 17 EST on December 23, 2007 through 11 EST on December 24, 2007 (each of the images in the time series can be displayed by rolling your mouse over the valid time of the forecast). At the beginning of the forecast period -- December 23 at 17 EST -- the water level at Toledo was anticipated to be 2.5 feet below and 2.5 feet above low water datum at Buffalo. Based upon the LEOFS guidance, the displacement was expected to reach its peak at 4:00 EST on December 24th, with a 6.0 foot decline at Toledo and an increase of 5.0 feet at Buffalo.
Observations The HPC Surface Analysis chart at 18Z on December 23, 2007 showed the center of a deep occluded low pressure system over Lake Superior. The system's cold front was near Buffalo, exposing Lake Erie to the system's robust westerly and southwesterly flow.
As shown on the trace (above right) of wind speed, gusts and barometric pressure observations from the C-MAN station on South Bass Island, the winds in the range or above 35 knots from early morning on December 23rd until the morning of December 24th. During late afternoon on the 23rd, a sustained wind of 45 knots and gusts to 52 knots were recorded. An examination of the wind during the afternoon of December 23rd shows that the direction was southwesterly and in near perfect alignment with the orientation of Lake Erie.
The displacement of water during the storm was far less than the historic high of 18 feet, but dramatic nonetheless. The graphs of the observed water level heights (above) documents that the storm resulted in a drop of nearly 5 feet at Toledo and 5 foot rise at Buffalo. A photo gallery of pictures related to the storm is located here.
The Aftermath No storm lasts forever, and by 18Z on December 24, 2007, the low pressure system had progressed several hundred miles to the northeast. The slackening pressure gradient and resultant decrease in wind speed foretold the end of the displacement. In response, a seiche formed as gravity worked to restore equilibrium on the lake.
The Water Level Displacement forecast (above) issued at 12Z on December 24, 2007 predicted the water level at three stations on Lake Erie, Toledo (blue), Cleveland (green) and Buffalo (red). Plotting the water level displacement forecast in this fashion makes it very easy to correlate the simultaneous negative displacement at Toledo and the positive displacement at Buffalo. The signature oscillation (sloshing) of water associated with the seiche is clearly evident. The Water Level Displacement forecast issued at 0Z on December 25, 2007 predicted that it would take more than two days for the level of Lake Erie to reach equilibrium.
© 2005-2008 Mark A. Thornton www.LakeErieWX.com |
|||||||||||||||||||||||||||||||||||||||||||||||||||||||


